Back in the days when we had one server and maybe ten concurrent users. When we used to shut down the system for half a day to deploy a new release. When browsers version numbers were single digits. Back then we did read log files like books. I mean not for leisure, no no! I want to say if a customer called and reported a problem we used to do the following: We grabbed a fresh cup of coffee and cracked our fingers. Maybe we called the intern over to watch and learn. Then we sshed into the production server. Copied the log file to our local machine and started to grep for error messages. Once we found the interesting spot we read through the log line by line to understand what had happened. We were like Cypher in “Matrix” seeing through the code.
Like some other things this has changed since 1999 when Matrix was released. Today there are many servers, DB, load-balancer, reverse proxy and much more generating logs. Instances come and go as user numbers increase and decrease. Hopefully there are more than ten users online at the same time. Also there is better no way for any developer to ssh into production servers anymore.
What has not changed is that logs give us valuable information on what has happened on our system. Its just that this information is no longer generated by a single service. Rather it is fragmented and spread over many servers. Maybe some are offline at the moment To still be able to have a complete picture about today’s polyglot systems all the logs need to be collected in a central location.
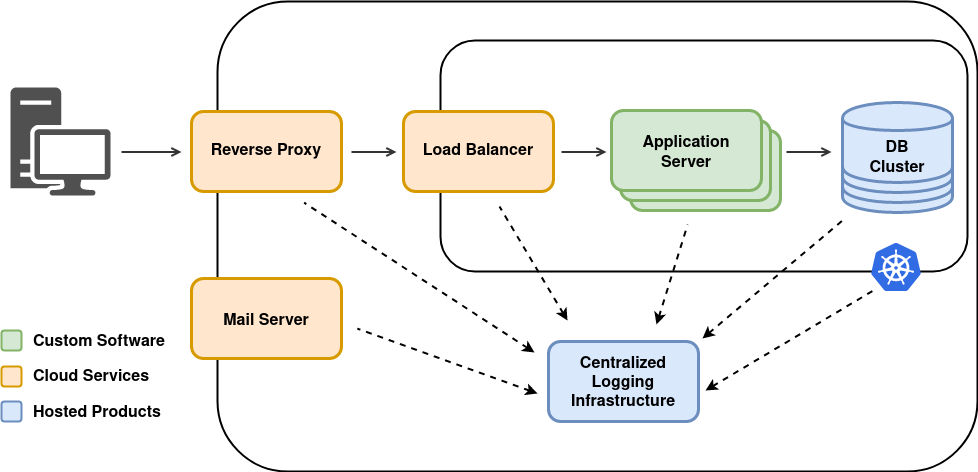
There are several products available which allow harvesting, storing, analyzing and managing of logs. Among the most widespread are Graylog and ELK (Elasticsearch, Logstash and Kibana). Both of them allow looking at logs by time, origin, severity and other criteria. They also have more sophisticated tools which support extracting even more information from the collected data. We do not want to give a recommendation. Have a look at both and maybe even a third solution.
Simply dumping all the log messages into the central storage will give you a big pile of strings but not much information. In a centralized logging facility the context of the log becomes as important as the message. It is not sufficient to see a message “Disk almost full”. You also need to know where this message originated, which software generated the message, what version was running at that time, which user was logged in and much more.
This context needs to be collected on the system where the log message is created. So it is the responsibility of the application to provide this information together with the log message. It is a tedious work to collect and add this to each and every log. If this is done manually then most likely it will be forgotten more than once.
Exactly here will Rico assist you and take all the burden from your shoulders.
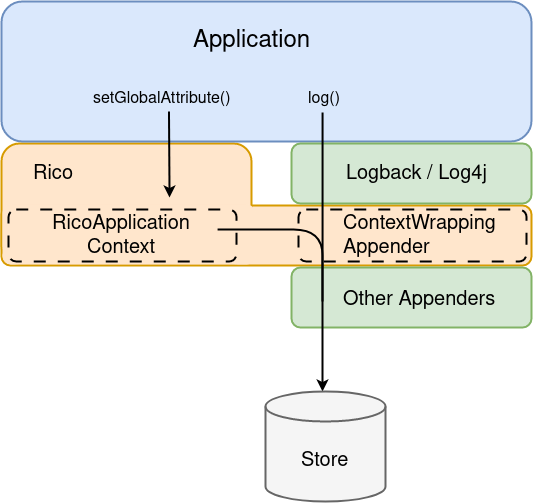
Rico provides the RicoApplicationContext (documentation) which is basically a dictionary to store context information.
Basic information such as application name, application version and much more are prefilled into the dictionary by Rico.
Application specific information can be added to this dictionary as needed during runtime.
Such entries can be either global or just for the current thread.
final RicoApplicationContext ricoContext = ...  // can be injected in spring and jakartaEE applications

ricoContext.setGlobalAttribute("application.type", "microservice");
ricoContext.setThreadLocalAttribute("thread.type", "background thread");
Now that all this context information is collected in the RicoApplicationContext all that is left to do is to include it in the log message.
For this task Rico provides log appender for Logback and Log4j2.
These appender take the message and place the entire content of the RicoApplicationContext to the MDC (Mapped Diagnostic Context).
The MDC is also dictionary and meant to carry the context information of a log message.
Now everything is ready to be sent to the centralized logging facility.
For sending log messages to a centralized logging facilities there exist many good solutions. One possibility is to use a log appender and send the message to the server instead of writing it to a file. Such appender are available for both Logback and Log4j. We have made good experience with both logstash-gelf and Logback GELF. They use GELF (Graylog Extended Log Format), a defacto standard to send log messages over the wire.
After all this theory we would like to also show you how this can look in action. A ready to run example is available in the rico samples project. It contains a Readme with all the information required to run it. There are also preconfigured docker images for both Graylog and ELK as well as sample applications using Logback and Log4j2.
 Stephan Classen is a co-founder of Karakun and lives in Graubünden. He has more than ten years of experience as a fullstack software developer and a passion for clean and maintainable code.